Hypothesis Testing
- Usually the hypothesis being tested is either:
- Whether two groups’ values are different
- E.g., whether physicians or NPs provide clearer instructions for self-care at discharge
- Whether two variables are related to each other
- Whether two groups’ values are different

Hypothesis Testing (cont.)
- The “null” hypothesis is that there is no effect/difference
- The p-value is technically the probability of finding the given pattern of data if the null is true
- It’s couched this way mainly for philosophical reasons
- I.e., that we can’t prove an effect,
- But simply that there doesn’t seem to be
nothing
- But simply that there doesn’t seem to be
- Kind of like in criminal court
- We don’t say that someone is “innocent,”
- But that they are “not guilty”—that there
isn’t enough evidence to prove guilt
- I.e., that we can’t prove an effect,
Hypothesis Testing (cont.)

Hypothesis Testing (cont.)

Hypothesis Testing (cont.)

Hypothesis Testing (cont.)

Hypothesis Testing (cont.)

Hypothesis Testing (cont.)
Odds of Being Diagnosed with Various Comorbidities Among Older Adults with Opioid Use Disorders
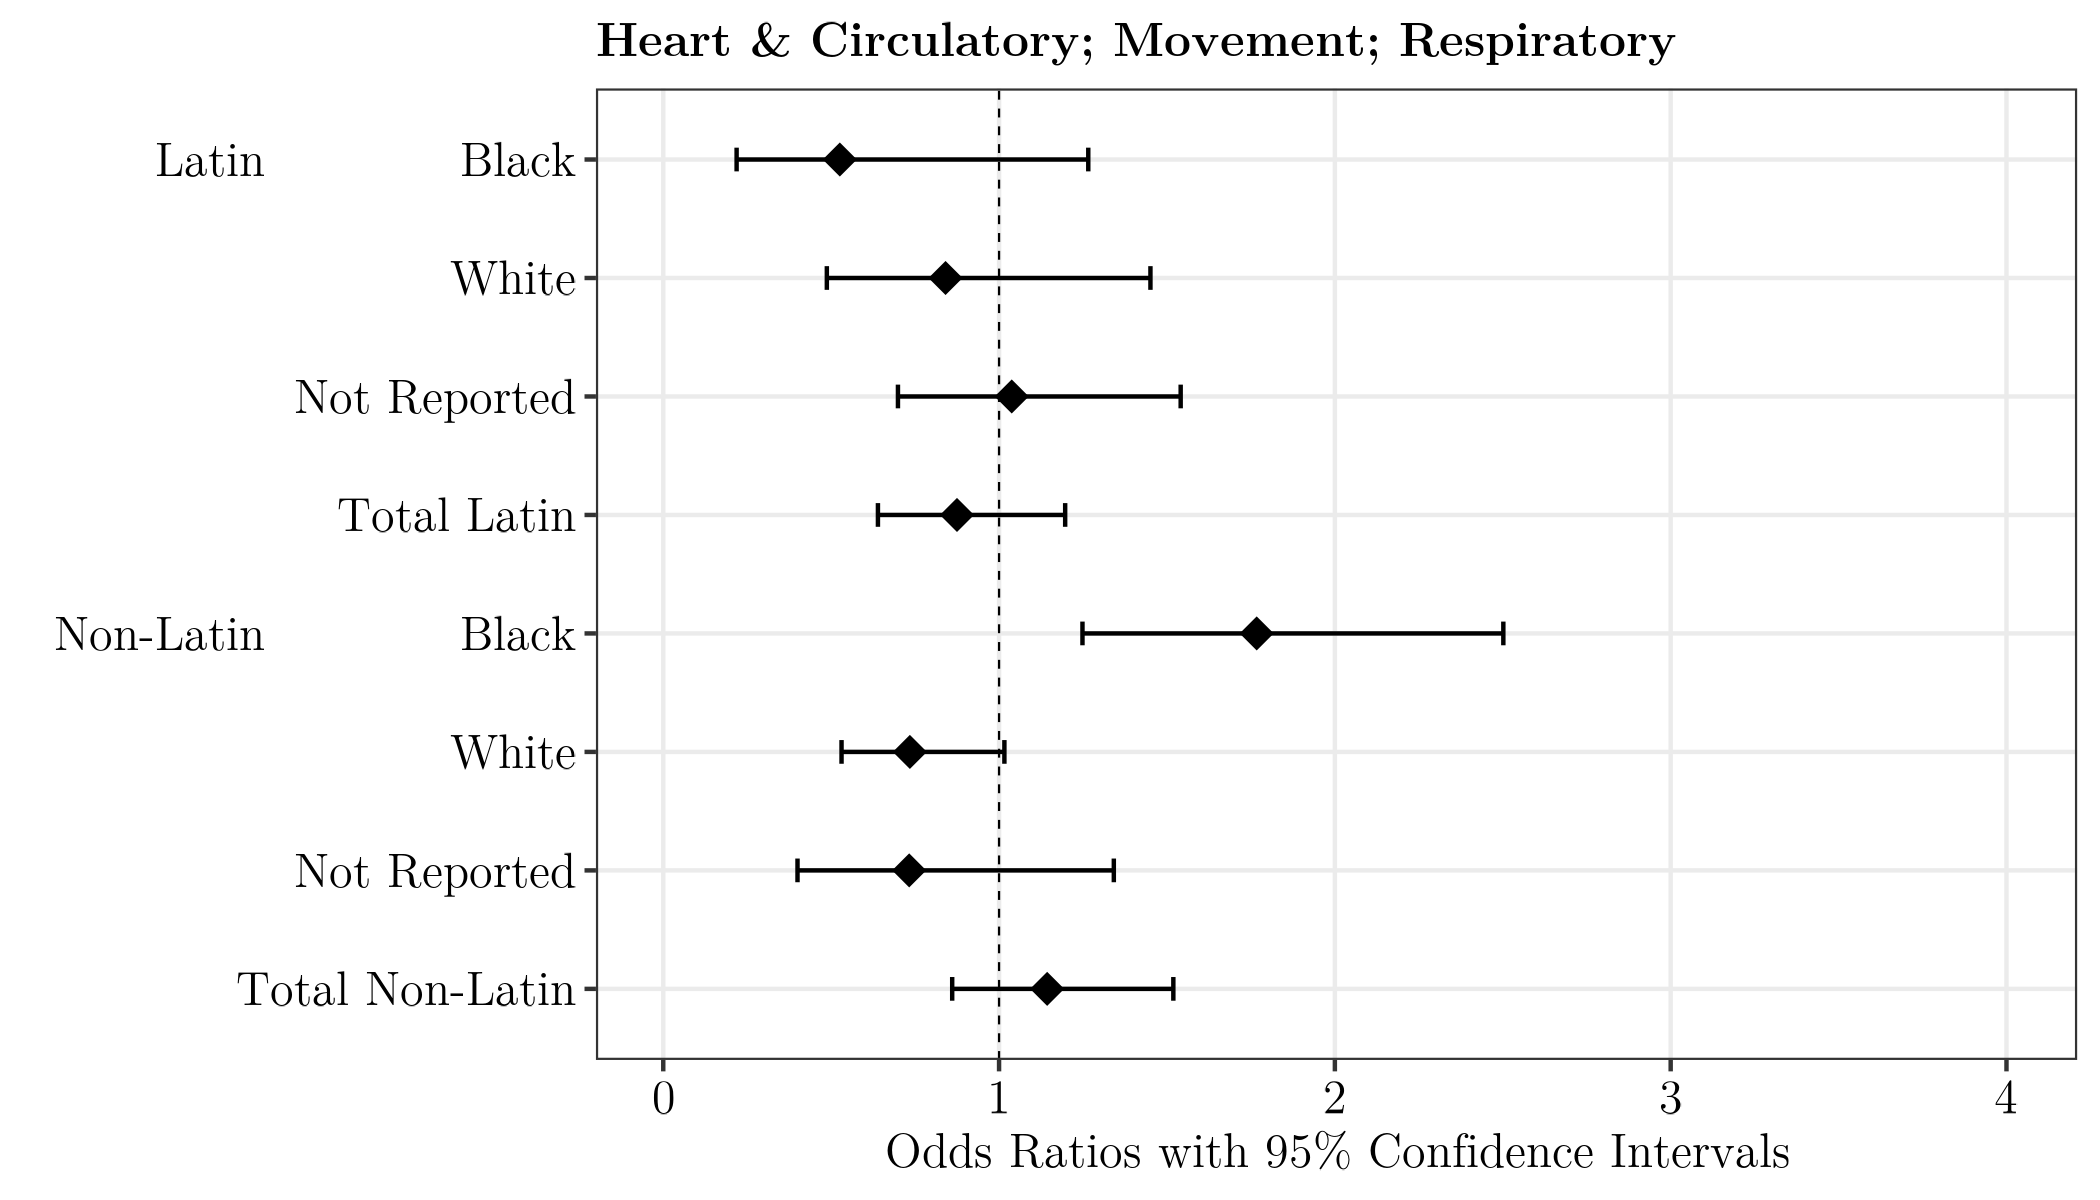
Baumann, S. & Samuels, W. E. (2024). Comparing comorbidities of older adults with opiate use disorder by race and ethnicity. Journal of Addictions Nursing, 34(12), 1280 – 1288. doi: 10.1097/JXX.0000000000000801.
Signal-to-Noise Ratio
- Generally, information in a sample of data is placed into
two categories:- “Signal,” e.g.:
- Difference between group means,
- Magnitude of change over time, or
- Amount two variables co-vary/co-relate
- “Noise”, e.g.,
- Differences within a group
- “Error”—anything not directly measured
- “Signal,” e.g.:

t and F Statistics
- Very common tests of differences in means
- These are signal-to-noise ratios
- Cannot be significant if there is more noise than signal
- I.e., if t < 1 or if F < 1
- If >1, then can be significant if the sample is big enough
- t is used to test the mean difference between
two groups
(“t for two”)- F is typically used for three or more groups
- Mathematically:
- The distributions of each strongly resemble
normal distributions - t² = F
- The distributions of each strongly resemble

t-Tests
- Also called Student’s t
- Invented
by William
Gosset
- Devised to test differences in small samples
- Tests the size of a mean difference against a distribution of size
differences one would expect if there was no real difference
- I.e., if we got that mean difference just by chance

t-Tests (cont.)
- The distribution tested against is a t-distribution
- As the sample size increases, it approximates the normal distribution
- Shape is determined by the degrees of freedom:
- For small degrees of freedom,
- It is more spread out and has heavier tails
- For large degrees of freedom (df > 30 or so),
- It closely resembles a normal distribution
- For small degrees of freedom,

Example of t-Tests

\(\beta\)-weights are tested via t- or F-tests.
Associations between:
- Nurse staffing & skill mix and
- Hospital Consumer Assessment of Health Care Providers & Systems (HCAHPS) measures
- In pooled cross-sectional and longitudinal regression models
From Martsolf et al. (2016)
F-Tests
- Invented by Ronald Fisher
- Called “F” in his honor by George Snedecor, who used it in his contributions to creating ANOVA family tests
- Devised to test signal-to-noise ratios
- Thus seeing if enough variance is accounted for by an effect to be considered significant

F-Tests (cont.)
- Turns out to be simply the square of a t-score (F
= t2)
- (And likewise tested against an F-distribution that also approximates a normal dist.)
- Note that F-tests are relatively sensitive to
deviations from normality
- t-Tests are a bit
less sensitive
- t-Tests are a bit
